How to create matplotlib figures from spreadsheet data
In this tutorial, we will learn how to create matplotlib figures from spreadsheet data using matplotlib.online functionality. This is a common task in data analysis and importing data from spreadsheets into python can be tedious.
We will start by creating a new project, go to matplotlib.online and click on the "New project" button. This will create a new project with a default python script. The project page consist of a code editor and a plot preview area. The main buttons are shown below:

It is important to note that you can also run the code using CTRL+S (or CMD+S on Mac), which is more convenient than clicking the "Run" button.
Now, let's create a simple from the following spreadsheet data:
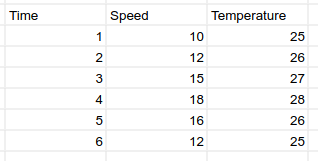
Select the data in the spreadsheet and copy it to the clipboard (by using CTRL+C or CMD+C). Then, press the button in the code editor and select the plot type that you want to create. In this case, we will select a line plot:

Once you select the plot type, paste the data into the text area and click "Import":
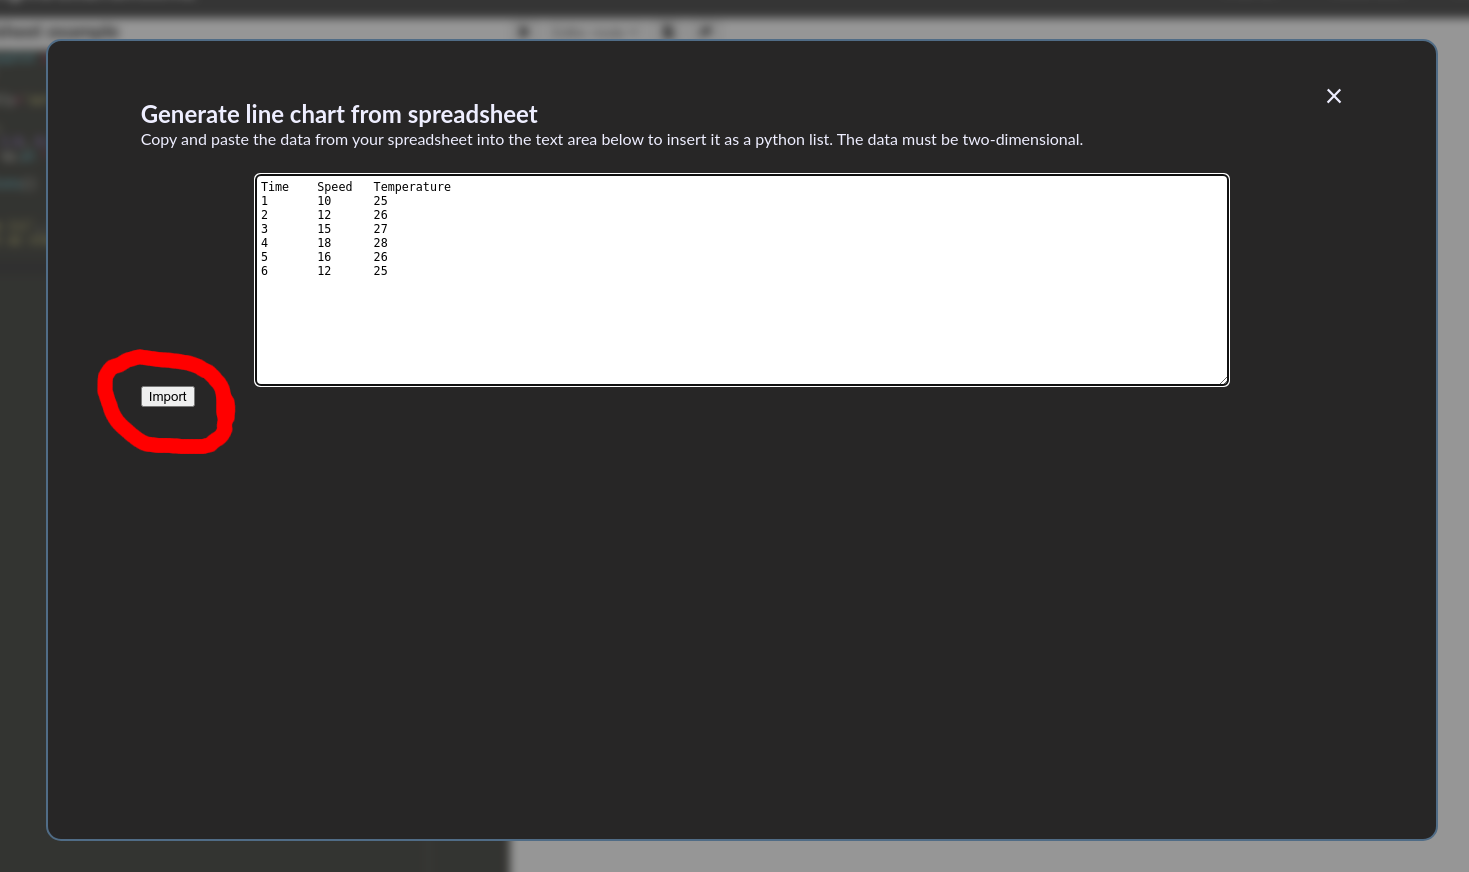
The data will be imported into the code editor and the plot will be displayed in the plot preview area. Keep in mind that the plot code will be added to the code editor, so you may need to remove any existing code before importing the data.
